Slide-by-Slide Recommendations
×
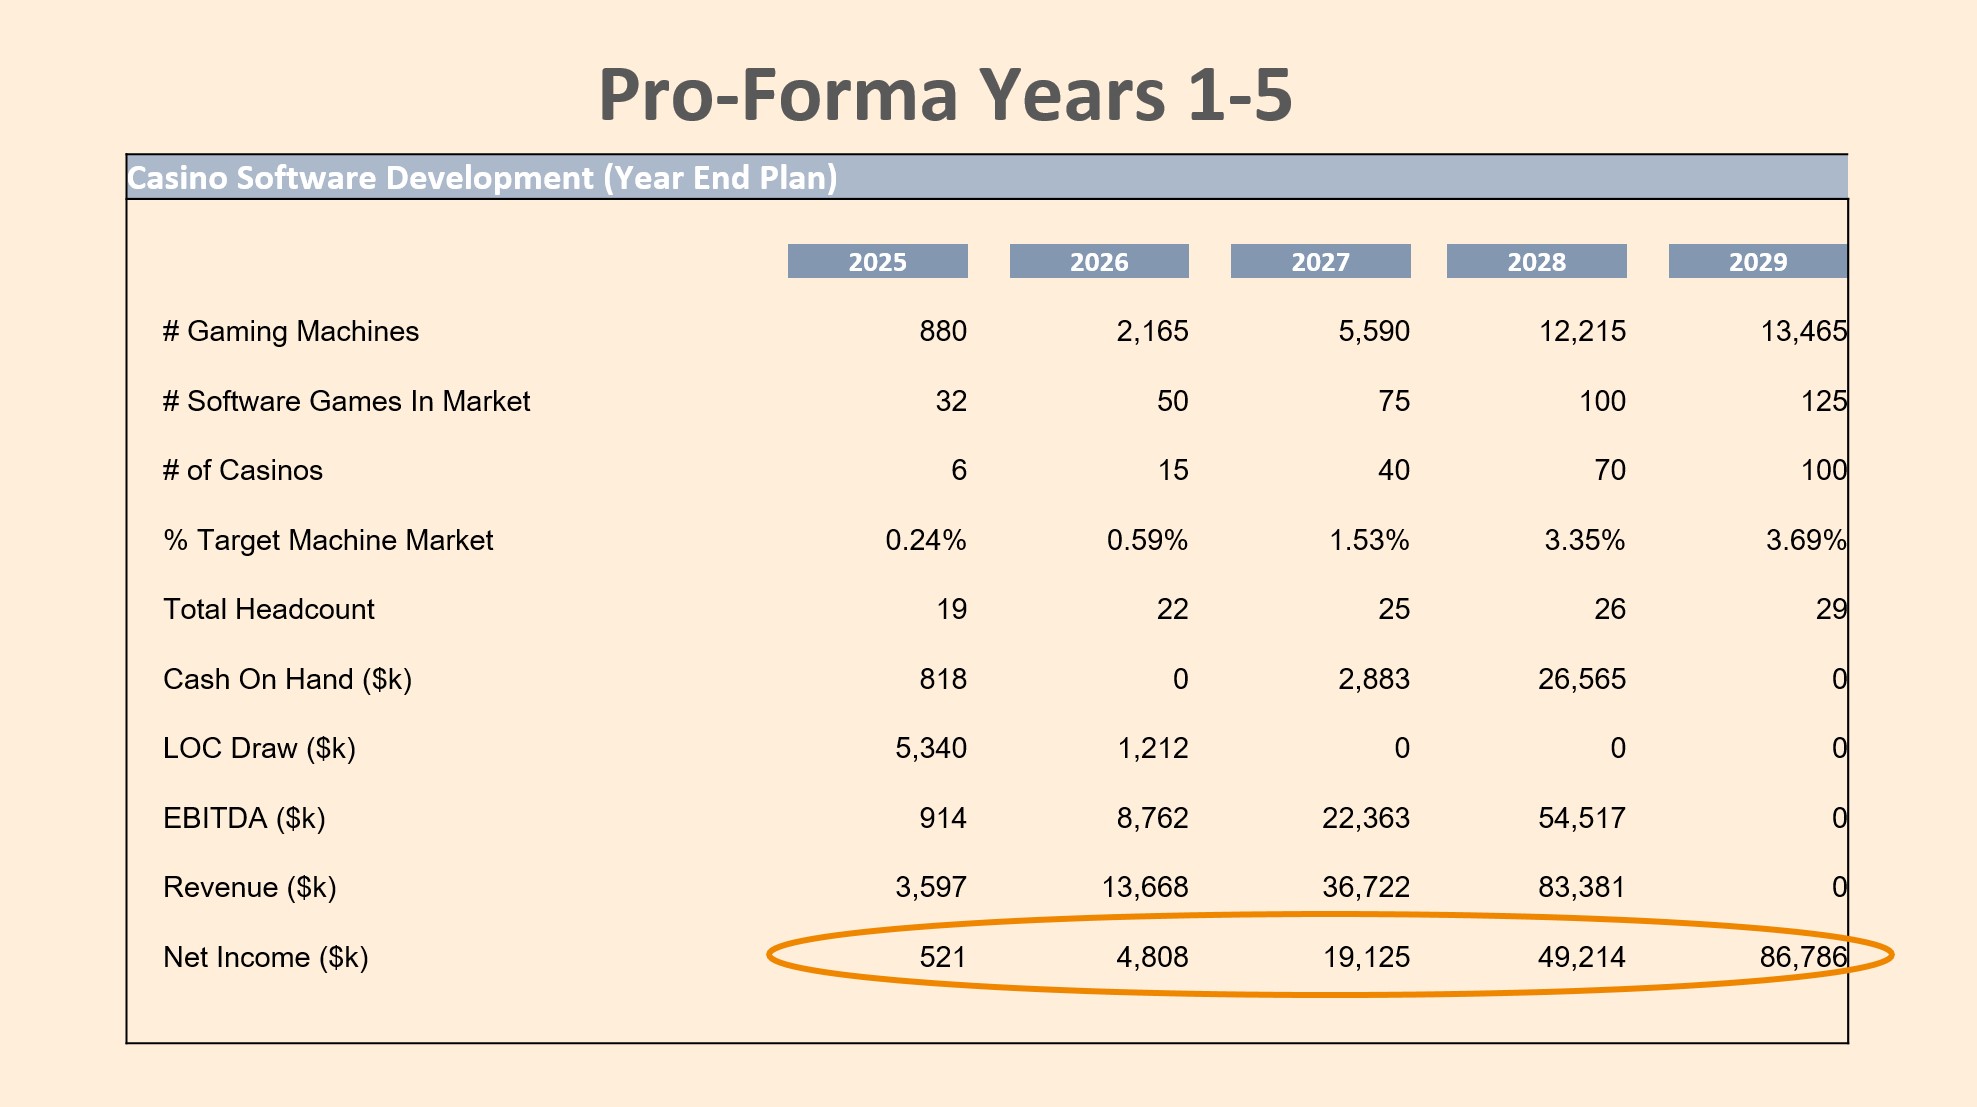
- Data Visualization: Replace the text-heavy table with a combination of a line graph for key growth metrics (e.g., Gaming Machines, Revenue, Net Income) and a few highlighted numbers for the most impactful data points.
- Focus on Key Metrics: Reduce the number of metrics to concentrate on the most crucial indicators of business success. Prioritize metrics like Gaming Machines, Revenue, EBITDA, and Net Income. Remove less impactful or redundant metrics.
- Narrative Emphasis: Add a brief bullet point list (3-4 points) highlighting key takeaways from the projections. For example, emphasize the projected growth rate, the scale of market penetration by 2029, or the path to profitability. This guides attention to the most important aspects.